Epsilon GC and ZGC : New Garbage Collectors in JDK 11

As we know that after Java 8, Java 11 is the latest version with Long Term Support (LTS). Java 11 introduced two new garbage collectors : Epsilon GC and ZGC. Before jumping to the newly introduced GCs, let’s have a brief look on various types of GC’s :
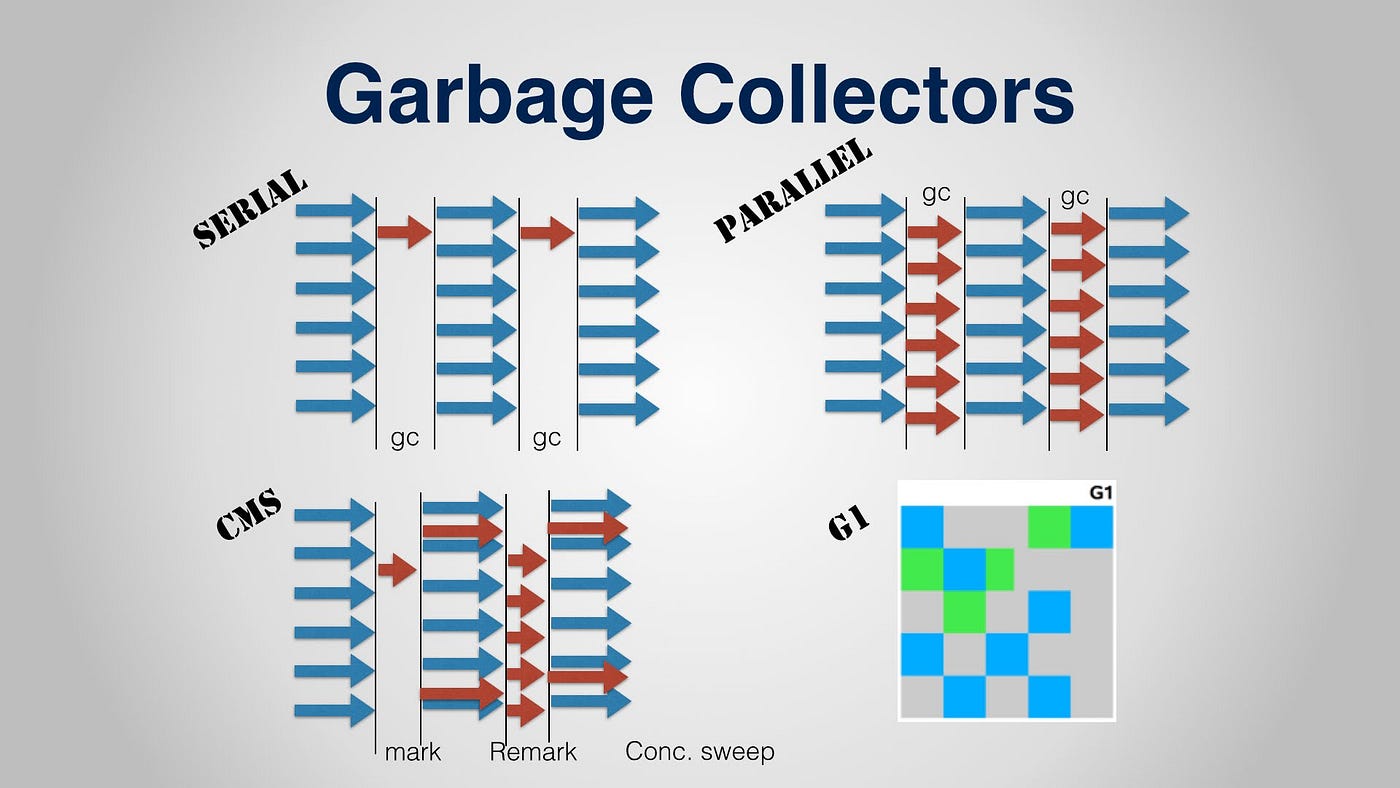
Garbage Collectors in JAVA
GC basically performs three steps during garbage collection process :
Mark : Garbage collector identifies the unreachable objects and creates a list of live objects i.e reachable objects.
Relocation : In this step, GC updates the references to the objects that will be compacted (delete unreachable objects).
Compacting : In this step the GC reclaims the space occupied by the dead objects and compacts the surviving objects. It involves copying the live objects from eden/survivor to survivor regions and later toward the older end of the segment.
There are basically three types of Garbage collectors excluding G1 GC which is the newest garbage collector from JDK 7 update 4 and later releases.
- Serial GC : The serial GC runs on a single thread. Whenever the generation in heap gets full, the application will stop/pause and GC will be performed clearing the unreachable objects.
- Parallel GC : The parallel GC uses multiple CPU’s/threads to perform garbage collection i.e multiple threads are responsible for peforming all the three steps mentioned above.
- Concurrent GC : The concurrent GC involves a single thread which will run concurrently with our java application. It doesn’t pause the main application while deleting or compacting but pause the main application for a short period of time during the initial mark and remark phases.
If we talk about the application measure in terms of performance and thorughput : if our application demands high latency with shorter pauses then concurrent GC is preferrable and when the application demands high throughput and can withstand pauses then parallel GC is preferrable.
So keeping all these things in mind , G1 garbage collector is fully supported in Oracle JDK 7 update 4 and later releases. The goal of the Garbage First (G1) GC was to balance between latency and throughput and hence is a combination of parallel and concurrent Garbage collectors. The default pause target for G1 is 200 millisecs. But It also provides programmers to give application pauses for GC in command line or so.
WORKING OF G1 GC
The G1 divides the heap memory into many small regions and the region size depends upon the memory allocated to the heap. e.g : if 4GB is alocated to heap then the multiple regions will be 2048 with each region size of 2MB and these regions can be eden , survivor or humongous(old generation).
Marking of the live objects in G1 is done concurrently, not stopping our java application but when the eden is filled up, the garbage collection occurs which involves copying all the live objects to the survivor regions. This process takes a short pause also known as the evacuation pause.
The main aim of G1 GC will be to get as much as free heap back from small regions by collecting those regions which will have the most garbage while also trying its best to meet the pause time goal and hence its name is the garbage first. As a result G1 GC gives better heap utilization with parallelism and concurrency together.
Epsilon : A No-Op Experimental Garbage Collector
Epsilon is a Garbage Collector that handles memory allocation but doesn’t perform the actual memory reclamation mechanism. Hence once the overall java heap is exhausted it will shutdown the JVM throwing an OutOfMemoryError.
The goal of creating this GC is to provide the lowest latency overhead possible with a bounded memory allocation limit but at the expense of memory throughput. It basically means to know that the available heap will be enough for our application, so we don’t want the JVM to use resources to run GC tasks(short pauses). It removes the impact of GC’s has on performance and the code runs in total isolation.
- Epsilon GC can be mainly used for performance testing : like how garbage collection affects your application performance and what is your application memory threshold.If you think that your application will need 4GB of memory then we can run it with argument
-Xmx4gand if JVM crashed, we can rerun it with-XX:HeapDumpOnOutOfMemoryErrorenabled and then can take a look at the heap dump to know where or which process has consumed more memory. - Also Epsilon GC is useful for applications where we have to do a last-drop latency improvements i.e for ultra latency sensitive applications, where we are consious about memory allocations and know the application memory footprint and where accepting the GC cycle can be an issue. In those applications, long GC cycle can be a problem because that prolongs the detection of the failure, and ultimately delays recovery. In that cases letting load balancers figure out failover — is sometimes a better recovery strategy than accepting a GC cycle.
Hands On
Let’s do a quick hands on Epsilon GC. Here we will create an application which will create huge amount of garbage.
class GarbageMemoryEpsilon{    static final int MEGABYTE_IN_BYTES = 1024 * 1024;
    static final int ITERATION_COUNT = 1024 * 10;    static void main(String[] args) {
        System.out.println("Starting pollution");        for (int i = 0; i < ITERATION_COUNT; i++) {
            byte[] array = new byte[MEGABYTE_IN_BYTES];
        }        System.out.println("Terminating");
    }
}
This code creates one-megabyte-arrays in a loop. Since we repeat the loop 10240 times, it means we allocate 10 gigabytes of memory, which is probably higher than the available maximum heap size. We also provided a sysout message when the application terminates. When we run the application with the standard VM options, it completes fine as when heaps get full the garbage collection takes place and clears all the grbage i.e unreachable objects :
Starting pollution
Terminating
To enable Epsilon GC, we need to pass the following VM arguments:
-XX:+UnlockExperimentalVMOptions -XX:+UseEpsilonGCAnd when we run the application with Epsilon GC VM arguments i.e withXX:+UnlockExperimentalVMOptions -XX:+UseEpsilonGC , we will get the following error.
Starting pollution
Terminating due to java.lang.OutOfMemoryError: Java heap space
ZGC: A Scalable and Experimental Low-Latency Garbage Collector
ZGC intends to provide the pauses as short as possible. It achieves it in such a way that the duration of these pause times doesn’t increase with the heap size. These characteristics make ZGC a good fit for server applications, where large heaps are common, and fast application response times are a requirement. ZGC promises not to exceed application latency by 10 milliseconds. ZGC achieves this by using coloured pointers to mark memory and copy and then relocate it, all concurrently. It also uses load barriers to keep track of heap usage.
When data move from one part from another, reference for that object also moves.This could cause problem if at the same time another value got set in that object. To solve this problem, ZGC stores object metadata eg. if object has been marked,etc. ZGC has a phase called marking, where we find the reachable objects. A GC can store object state information in multiple ways like map ,etc. but it uses a different approach: it stores the reference state as the bits of the reference. It’s called reference coloring. But this way we have a new challenge. Setting bits of a reference to store metadata about an object means that multiple references can point to the same object since the state bits don’t hold any information about the location of the object. So in that case multimapping is required.
COLORED POINTER : 42 bits to represent the address itself. As a result, ZGC references can address 4 terabytes.

- finalizable bit — the object is only reachable through a finalizer.
- remap bit — the reference is up to date and points to the current location of the object.
- marked0 and marked1 bits — these are used to mark reachable object
Working of ZGC

- ZGC divides memory into regions, also called ZPages. Z-Pages can be dynamically created and destroyed.
- ZGC works concurrently with your application, performing all its work in its threads. It uses load barriers for heap references. Load barriers cause fewer delays than those imposed by the G1 collector’s pre- and post-write barriers.
- ZGC takes advantage of 64-bit pointers with a technique called pointer coloring. Colored pointers store extra information about objects on the heap. (This is one of the reasons it’s limited to the 64-bit JVM.) By limiting the GC to 4TB heaps, the developers have 22 extra bits in each pointer to encode additional information. Z uses four extra bits at the moment. Each pointer has a bit for finalizable, remapped, mark0, or mark1.
- The Z garbage collector remaps objects when the memory becomes fragmented. The mapping avoids the performance hit incurred when the GC needs to find space for a new allocation. Pointer coloring helps with remapping since a remapped reference discovers the new location at the next access.
- When your application loads a reference from the heap, ZGC checks the extra bits. If it needs to do any extra work (e.g. getting a remapped instance), it handles it in the load barrier. It only has to do this once, when it loads the reference. This sets it apart from the write barriers used by mainline garbage collectors like G1.
- The Z garbage collector performs its cycles in its threads. It pauses the application for an average of 1 ms. The G1 and Parallel collectors average roughly 200 ms.
- We can enable ZGC with the following command-line options when running our application:
-XX:+UnlockExperimentalVMOptions -XX:+UseZGCCONCLUSION

Other than Epsilon and ZGC, Red Hat developed a new GC called Shenandoah with low pause times. It is introduced in Java 12 release. It also does most of its work in parallel with the running application. For the performance and latency sensitive Java applications, use of right type of Garbage Collector will always play an important role.
I hope this article is useful. Thank you.